
The SBU financial results for the year were up on 2024 in a life market context that, although recovering, continues to be challenging. The Solvency Ratio at 31 December 2025, stood at 303%, confirming the insurance Group’s high solvency ratio and well above the managerial aspiration (equal to 200% over the entire economic cycle).
Title: Insurance Services results
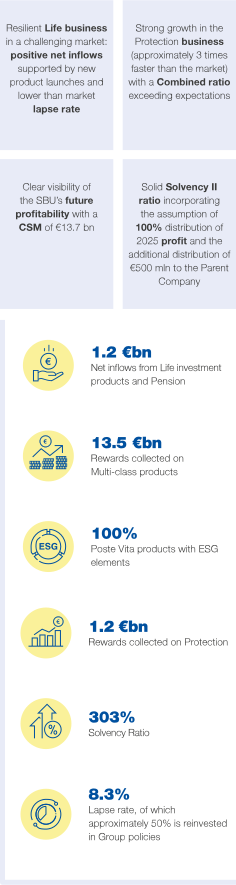
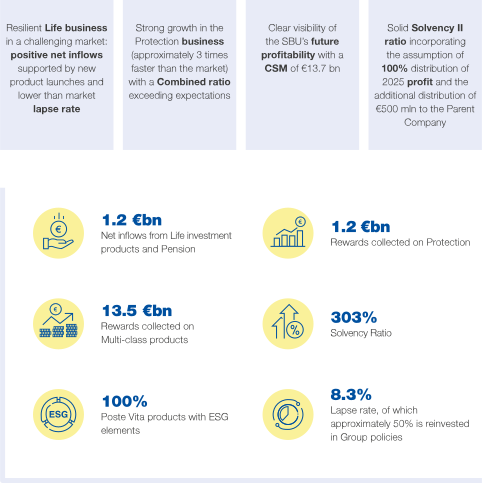
Insurance Services results are presented through four main messages and six key figures.
Main messages:
Resilient Life business in a challenging market: positive net inflows supported by new product launches and lower than market lapse rate
Strong growth in the Protection business, approximately 3 times faster than the market, with a Combined ratio exceeding expectations
Clear visibility of the SBU’s future profitability with a CSM of €13.7 bn
Solid Solvency II ratio incorporating the assumption of 100% distribution of 2025 profit and the additional distribution of €500 mln to the Parent Company
Key figures:
1.2 €bn
Net inflows from Life investment products and Pension
13.5 €bn
Rewards collected on Multi-class products
100%
Poste Vita products with ESG elements
1.2 €bn
Rewards collected on Protection
303%
Solvency Ratio
8.3%
Lapse rate, of which approximately 50% is reinvested in Group policies
Results and KPIs
| INSURANCE SERVICES (€m) | 2025 | 2024 | Changes | |
|---|---|---|---|---|
| External revenue | 1,825 | 1,640 | +185 | +11.3% |
| Revenue from other sectors | (198) | (160) | (38) | -23.6% |
| Total revenue | 1,627 | 1,480 | +147 | +9.9% |
| Costs* | 76 | 78 | (2) | -3.0% |
| Costs vs other sectors | 28 | 31 | (3) | -9.0% |
| Total costs | 104 | 109 | (5) | -4.7% |
| EBIT | 1,523 | 1,371 | +152 | +11.1% |
| Adjusted EBIT** | 1,585 | 1,429 | +156 | +10.9% |
| NET PROFIT | 1,077 | 1,033 | +44 | +4.2% |
* The item includes the contribution to the Life Insurance Guarantee Fund amounting to €61 million in 2025 and €58 million in 2024.
** For the reconciliation between EBIT and adjusted EBIT, please refer to the reconciliation table in paragraph 7.2 “Other Information”.
| Operating KPIs | 31 December 2025 | 31 December 2024 | Changes | |
|---|---|---|---|---|
| Net technical provisions Poste Vita Group (in €bn)1 | 170.2 | 166.1 | +4.2 | +2.5% |
| Contractual Service Margin (CSM)2 (€bn) | 13.7 | 13.7 | (0.1) | -0.5% |
| Solvency Ratio | 303% | 323% | ||
| Investment and Pension | 2025 | 2024 | Changes | |
|---|---|---|---|---|
| Gross premium revenue - Investment and Pension (€m)3 | 19,836 | 17,966 | +1,870 | +10.4% |
| of which: Classes I-III-V | 6,302 | 10,337 | (4,036) | -39.0% |
| of which: Multi-class4 | 13,534 | 7,629 | +5,906 | +77.4% |
| Net inflows (€m) | 1,203 | 1,544 | (341) | -22.1% |
| Lapse rate | 8.3% | 6.6% | ||
| of which % reinvested in the Group's life investment and pension products | 50.0% | 25.0% | ||
| Poste Vita products with ESG elements5 | 100% | 100% | ||
| Protection | 2025 | 2024 | Changes | |
|---|---|---|---|---|
| Gross premium - Protection (€m)6 | 1,222 | 1,014 | +208 | +20.5% |
| Combined ratio (net reinsurance)7 | 84.0% | 84.9% |
|
|
1. Technical provisions of the insurance business (Investment & Pension and Protection) determined in accordance with the national accounting standards used to prepare the separate financial statements of the Group’s insurance companies. The 2025 value does not include the balance at 31 December 2025 of the technical provisions of Cronos Vita Assicurazioni SpA transferred as a result of the merger into Poste Vita effective 1 October 2025 (about €1.9 billion).
2. Represents the present value of the expected and not yet realised profit that the Group will recognise on an accrual basis in profit and loss over the life of the contracts.
3. Includes written Investments and Welfare premiums, gross of reinsurance and intercompany portions of the Poste Italiane Group.
4. Includes gross premiums from Class I and Class III of Multi-class products.
5. All products with sustainability content consistent with the “Guidelines for defining the sustainability characteristics of products” approved by the CEO of Poste Vita in October 2023 and updated in December 2024 with the passage to the Board of Directors of the Product Oversight and Governance (POG) Guidelines, to which the methodologies relating to product development have been annexed, including the “Guidelines for defining the sustainability characteristics of products”.
6. Includes Protection gross premium revenue before the change in the premium reserve, outward reinsurance and intra-group portions of the Poste Italiane Group, as well as motor premiums intermediated.
7. Corresponds to the ratio of total costs incurred (claims and settlement expenses + net reinsurance expenses + attributable/non-attributable operating expenses + other technical expenses and income) to gross insurance revenue.
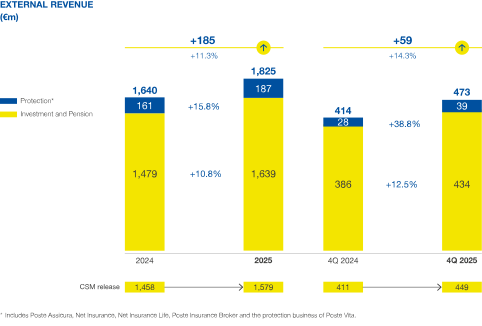
Title: External revenue
2024 external revenue:
Total external revenue: €1,640 million
€1,479 million Investment and Pension
€161 million Protection*
2025 external revenue:
Total external revenue: €1,825 million
€1,639 million Investment and Pension
€187 million Protection*
Change between 2024 and 2025:
Total external revenue increased by €185 million, equal to +11.3%.
Investment and Pension: +10.8%
Protection*: +15.8%
4Q 2024 external revenue:
Total external revenue: €414 million
€386 million Investment and Pension
€28 million Protection*
4Q 2025 external revenue:
Total external revenue: €473 million
€434 million Investment and Pension
€39 million Protection*
Change between 4Q 2024 and 4Q 2025:
Total external revenue increased by €59 million, equal to +14.3%.
Investment and Pension: +12.5%
Protection*: +38.8%
CSM release:
2024: €1,458 million
2025: €1,579 million
4Q 2024: €411 million
4Q 2025: €449 million
Note:
- Includes Poste Assicura, Net Insurance, Net Insurance Life, Poste Insurance Broker and the protection business of Poste Vita.