
Through its leadership in the logistics, financial, insurance and payment services sectors, Poste Italiane plays a key role in the creation of economic value both for the stakeholders directly impacted by its business activities and for the country as a whole.
In particular, the activities carried out by Poste Italiane generate impacts on GDP, employment income, employment and contributions to PA. The estimated impacts can be distinguished into:
- Direct impacts: impacts generated by the operating activities carried out directly by Poste Italiane;
- Indirect impacts: impacts generated along the supply chain as a result of Poste Italiane’s spending on goods and services (€4.2 billion in 2025) from Italian suppliers;
- Induced impacts: impacts generated by consumer spending that is realised through the income earned by workers employed directly and indirectly by the Group.
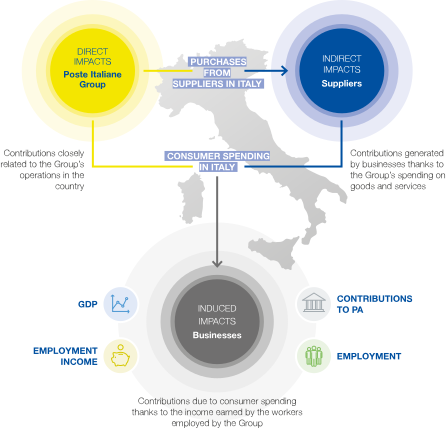
Title: Poste Italiane's Economic Value Creation Process
General Description: The infographic shows the process of economic value creation by Poste Italiane, represented through a series of colored circles and arrows indicating economic flows. At the center of the infographic is a map of Italy, which serves as the background for the various elements.
Main Elements:
Direct Impact (yellow circle):
Text: Poste Italiane Group
Description: Contributions closely linked to the Group's operational activities carried out in the country.
Arrow to the blue circle on the right (Indirect Impact): Represents purchases from suppliers in Italy.
Indirect Impact (blue circle on the right):
Text: Suppliers
Description: Contributions generated by companies thanks to the Group's expenditure on goods and services.
Induced Impact (light blue circle in the center):
Text: Companies
Description: Contributions due to consumer spending thanks to the income earned by workers employed by the Group.
Arrow downwards: Indicates consumer spending in Italy.
Contributions to the PA (icon of a gray building):
Description: Represents contributions provided to the Public Administration.
Employment (icon of green people):
Description: Indicates the employment generated by the Group.
GDP (icon of a blue chart on the left):
Description: Represents the impact on Gross Domestic Product (GDP).
Labor Income (icon of a yellow piggy bank on the left):
Description: Indicates the labor income generated.
Main Flows:
From the yellow circle (Direct Impact) to the blue circle (Indirect Impact): Purchases from suppliers in Italy.
From the blue circle (Indirect Impact) to the light blue circle (Induced Impact): Consumer spending in Italy.
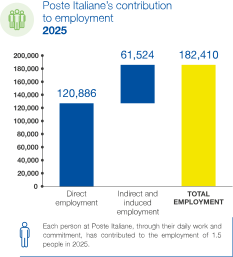
In 2025, the Poste Italiane Group had an impact on the country’s economy, in terms of Gross Domestic Product (GDP), of around €14 billion and employed a total of roughly 182 thousand people and contributed around €2.6 billion in tax revenue to the Public Administration. Furthermore, it is estimated that Poste Italiane contributed directly and indirectly to the distribution of income to workers, totalling over €7 billion.
Poste Italiane’s creation of value is based on the contribution that the Group’s individual people make through their daily work and commitment. Indeed, during 2025, each Poste Italiane person contributed to the creation of economic impacts for the territory amounting to €115 thousand of GDP, €59 thousand of income for families, €22 thousand of tax contributions and the employment of 1.5 people.
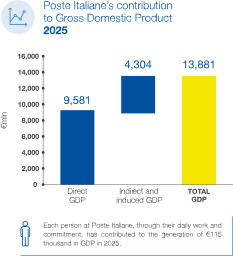
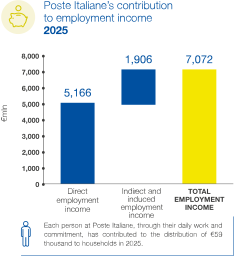
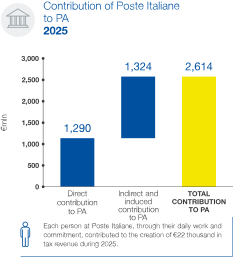
Title:
Poste Italiane’s economic contributions in 2025
Description:
The infographic is divided into four panels summarising Poste Italiane’s overall economic contribution in Italy in 2025:
Gross Domestic Product (GDP)
- Direct GDP: €9,581 million
- Indirect and induced GDP: €4,304 million
- Total GDP: €13,881 million
Note: Each person at Poste Italiane, through their daily work and commitment, contributed to the creation of €115 thousand in GDP during 2025.
Employment income
- Direct employment income: €5,166 million
- Indirect and induced employment income: €1,906 million
- Total employment income: €7,072 million
Note: Each person at Poste Italiane, through their daily work and commitment, contributed to the distribution of €59 thousand to households during 2025.
Contribution to Public Administration (PA)
- Direct contribution: €1,290 million
- Indirect and induced contribution: €1,324 million
- Total contribution: €2,614 million
Note: Each person at Poste Italiane, through their daily work and commitment, contributed to the creation of €22 thousand in tax revenue during 2025.
Employment
- Direct employment: 120,886 people
- Indirect and induced employment: 61,524 people
- Total employment: 182,410 people
Note: Each person at Poste Italiane, through their daily work and commitment, contributed to the employment of 1.5 people during 2025.
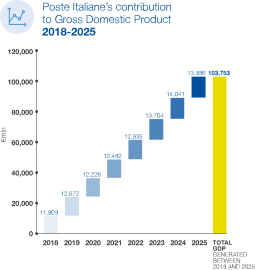
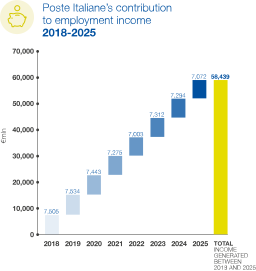
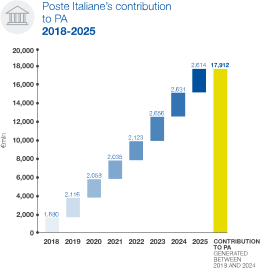
The commitment that Poste Italiane dedicates to serving the country’s economy is not limited to 2025, but is embedded in a path of annual value creation that has been ongoing for years. In fact, since 2018, Poste Italiane Group has generated total impacts for the Country of approximately €104 billion of Gross Domestic Product (GDP), €58 billion of employment income and €18 billion of tax revenue. In addition, the Group contributed an average of 188 thousand jobs between 2018 and 2025.
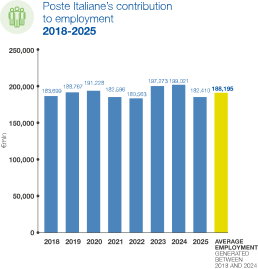
Title:
Poste Italiane’s economic contributions from 2018 to 2025
Description:
The infographic is divided into four panels showing Poste Italiane’s contribution to Gross Domestic Product, employment income, Public Administration and employment from 2018 to 2025.
Gross Domestic Product (GDP)
Values are expressed in € million:
- 2018: €11,908 million
- 2019: €12,572 million
- 2020: €12,226 million
- 2021: €12,482 million
- 2022: €12,935 million
- 2023: €13,704 million
- 2024: €14,041 million
- 2025: €13,886 million
- Total GDP generated between 2013 and 2025: €103,753 million
Employment income
Values are expressed in € million:
- 2018: €7,505 million
- 2019: €7,534 million
- 2020: €7,443 million
- 2021: €7,275 million
- 2022: €7,003 million
- 2023: €7,312 million
- 2024: €7,294 million
- 2025: €7,072 million
- Total income generated between 2013 and 2025: €58,439 million
Contribution to Public Administration (PA)
Values are expressed in € million:
- 2018: €1,680 million
- 2019: €2,116 million
- 2020: €2,058 million
- 2021: €2,035 million
- 2022: €2,123 million
- 2023: €2,656 million
- 2024: €2,631 million
- 2025: €2,614 million
- Contribution to PA generated between 2013 and 2024: €17,912 million
Employment
- 2018: 183,699 people
- 2019: 188,767 people
- 2020: 191,228 people
- 2021: 182,596 people
- 2022: 180,563 people
- 2023: 197,273 people
- 2024: 199,021 people
- 2025: 182,410 people
- Average employment generated between 2013 and 2024: 188,195 people
Impacts generated in individual Territorial Areas in 2025
Considering the region of the registered office of the suppliers, the indirect impacts generated by them in each Territorial Area in 2025 have been identified.
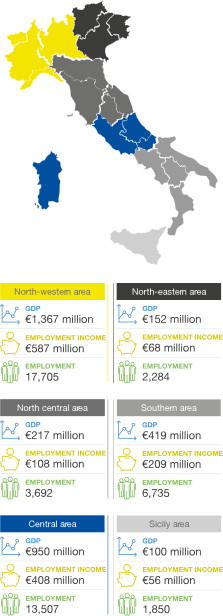
Title:
Impacts generated in Poste Italiane’s Territorial Areas in 2025
Description:
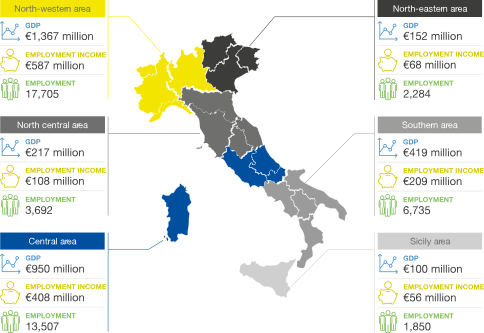
The infographic shows the indirect impacts generated by Poste Italiane’s suppliers in 2025, divided into six Territorial Areas according to the region in which each supplier has its registered office. For each area, it reports the GDP generated, employment income and employment.
North-western Area
The area comprises Lombardy, Piedmont, Liguria and Aosta Valley.
- GDP: €1,367 million
- Employment income: €587 million
- Employment: 17,705 people
North-eastern Area
The area comprises Veneto, Trentino-Alto Adige and Friuli-Venezia Giulia.
- GDP: €152 million
- Employment income: €68 million
- Employment: 2,284 people
North Central Area
The area comprises Emilia-Romagna, Tuscany, Umbria and Marche.
- GDP: €217 million
- Employment income: €108 million
- Employment: 3,692 people
Central Area
The area comprises Lazio, Abruzzo, Molise and Sardinia.
- GDP: €950 million
- Employment income: €408 million
- Employment: 13,507 people
Southern Area
The area comprises Campania, Apulia, Basilicata and Calabria.
- GDP: €419 million
- Employment income: €209 million
- Employment: 6,735 people
Sicily Area
The area comprises Sicily.
- GDP: €100 million
- Employment income: €56 million
- Employment: 1,850 people
Impacts of Italian SME suppliers
Considering the parameters defined by the European Commission, the Italian suppliers that are characterised as Small and Medium Enterprises (SMEs) and the indirect impacts attributable to them have been identified.
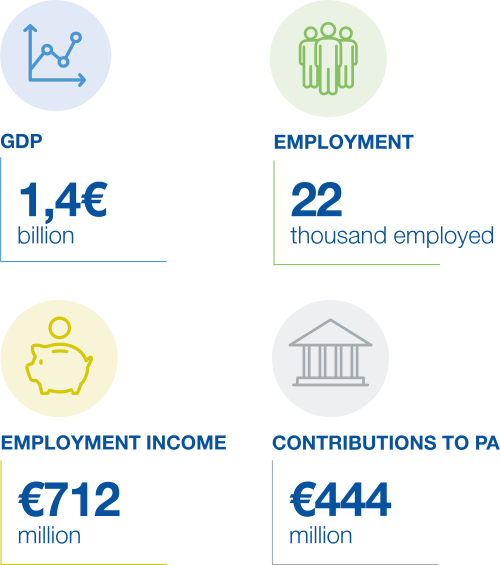
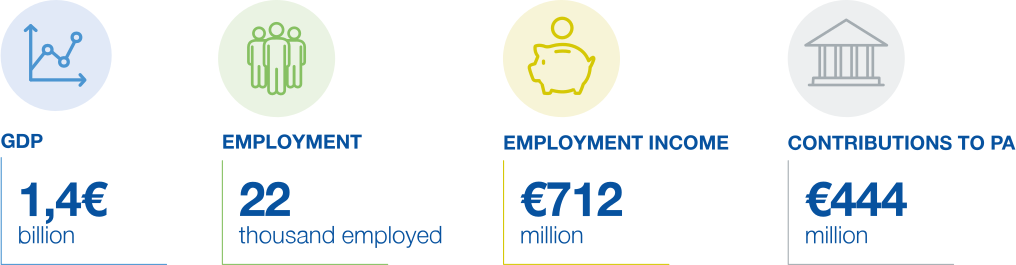
In 2025, SMEs impacted the level of Gross Domestic Product for a value of €1.4 billion, leading to the employment of over 22,000 people and an income distribution of €712 million. Finally, €444 million has been generated in terms of tax revenue.
Title:
GDP, employment, employment income and contributions to Public Administration
Description:
The infographic is divided into four panels showing the economic and employment impacts generated:
Gross Domestic Product (GDP)
- GDP generated: €1.4 billion
Employment
- Employment generated: 22 thousand employed
Employment income
- Employment income generated: €712 million
Contributions to Public Administration (PA)
.